Primary Functions
- Gain a complete picture of drought with weekly global maps of soil moisture and groundwater wetness conditions and one to three-month U.S. forecasts of each product.
Detailed Description
NASA researchers have developed new satellite-based, weekly global maps of soil moisture and groundwater wetness conditions and one to three-month U.S. forecasts of each product. While maps of current dry/wet conditions for the United States have been available since 2012, this is the first time they have been available globally.
These maps are distributed online by the National Drought Mitigation Center at the University of Nebraska-Lincoln (UNL) to support U.S. and global drought monitoring.
Monitoring the wetness of the soil is essential for managing agricultural crops and predicting their yields, because soil moisture is the water available to plant roots. Groundwater is often the source of water for crop irrigation. It also sustains streams during dry periods and is a useful indicator of extended drought. But ground-based observations are too sparse to capture the full picture of wetness and dryness across the landscape like the combination of satellites and models can.
Both the global maps and the U.S. forecasts use data from NASA and German Research Center for Geosciences’s Gravity Recovery and Climate Experiment Follow On (GRACE-FO) satellites, a pair of spacecraft that detect the movement of water on Earth based on variations of Earth’s gravity field. GRACE-FO succeeds the highly successful GRACE satellites, which ended their mission in 2017 after 15 years of operation. With the global expansion of the product, and the addition of U.S. forecasts, the GRACE-FO data are filling in key gaps for understanding the full picture of wet and dry conditions that can lead to drought.
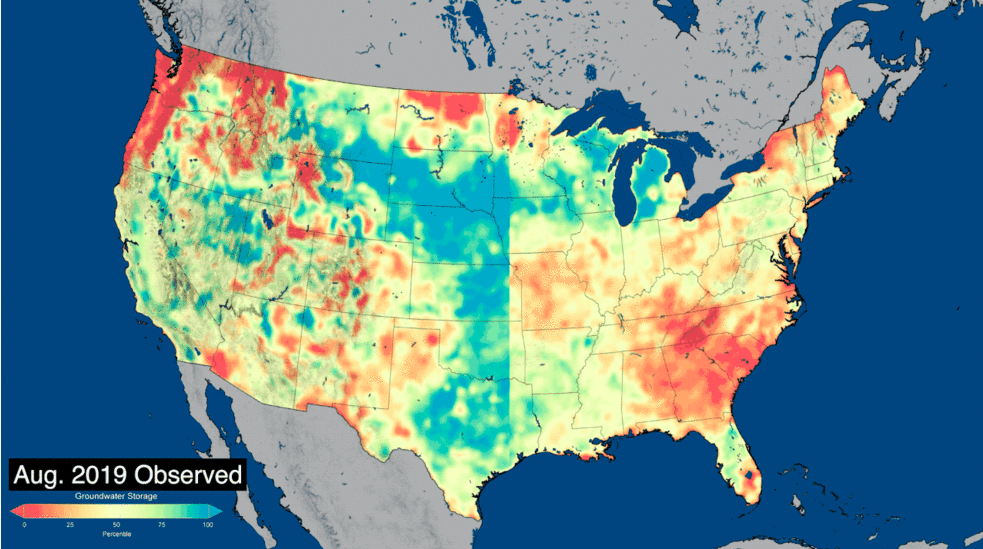
The satellite-based observations of changes in water distribution are integrated with other data within a computer model that simulates the water and energy cycles. The model then produces, among other outputs, time-varying maps of the distribution of water at three depths: surface soil moisture, root zone soil moisture (roughly the top three feet of soil), and shallow groundwater. The maps have a resolution of 1/8th degree of latitude, or about 8.5 miles, providing continuous data on moisture and groundwater conditions across the landscape.
The GRACE and GRACE-FO satellite-based maps are among the essential data sets used by the authors of the U.S. Drought Monitor, the premier weekly map of drought conditions for the United States that is used by the U.S. Department of Agriculture and the Federal Emergency Management Agency, among others, to evaluate which areas may need financial assistance due to losses from drought.